The MLB trade season is naturally a time of uncertainty. Last year’s megadeal where the Washington Nationals sent Juan Soto to the San Diego Padres was one such example of drastic and unforeseen changes. Shuffling the bullpen has become common practice, though, usually from non-contenders to playoff hopefuls. The age-old tradition of acquiring relievers is proof of the bullpen’s value to a team. It’s even more important today. Starters have been asked to pitch fewer innings in the past decade; maintaining leads and saving games remains critical.
The purpose of today’s article is not to speculate which relievers could be headed to the Twin Cities. Instead, it’s evaluating the bullpen. As a squad, Minnesota’s pitching ranks among the best in the league. Their eighth-best 3.76 ERA and ninth-best 1.24 WHIP are not incredibly surprising considering they employ the likes of Jhoan Durán, Caleb Thielbar, and Brock Stewart, aka “The Glock.” Despite the success they’ve enjoyed as a group, only Durán (12) has more than three saves. There are 19 MLB relievers with more saves than him, with the Los Angeles Dodgers’ Evan Phillips tied for 20th with 12.
Durán’s lack of saves potentially diminished his chances of earning an All-Star bid. It’s no fault of his own. He has worked in several different instances rather than appearing only in the 9th inning when save chances are present. Whether or not he deserves to be pitching in Seattle this week won’t be discussed here. However, his situation prompted me to take a closer look at evaluating the bullpen’s skill.
In a chapter of Tom Tango’s The Book called “Leveraging Relievers,” he examines win probability and the appropriate times and places to call upon different skill levels of relievers. Many people are familiar with the debatability of saves and their value in the game; Tango provides a thorough argument against them. By stating that teams leading by three runs win 97% of the time (in about 1,000 instances from 1999 to 2002), the value of saves is pushed further into question. Great pitchers only win about 2% more of the time than average pitchers do in three-run lead (save) situations. “For every one win you can get pitching your ace reliever with a three-run lead,” writes Tango, “you get two wins with a two-run lead, and three wins with a one-run lead.”
The point of bringing up Tango and his work is to set a solid foundation of thinking. Firefighter relievers, stoppers, high leverage – these are all terms that modern baseball managers have to think about. Utilizing players in a bullpen is not about saving your best guy until the game is essentially over. I argue that using the highest-skilled arms in the highest-leverage situations is the most important part of bullpen management. Platoon splits are also something to keep in mind, though not over-leverage.
With that being said, it is time to direct attention to another key piece of sports writing. John Foley of PitcherList approached bullpen management from a more modern perspective earlier this season. The folks at Fangraphs developed a statistic called game leverage index (gmLI) which quantifies how serious of a situation a reliever is entering. Highly skilled batters in likely scoring base/out states being the highest leverage situations, and therefore receive a higher gmLI number. We can see which Twins pitchers entered the toughest spots here.
Following Foley’s lead, we can also see whether the Twins filled their highest leverage spots with the highest quality arms. Foley tested to see if the 2022 Houston Astros bullpen was utilized in an optimal way, and I’m going to use the exact same steps for the 2023 Twins. Here’s a chart like the one found in Foley’s article with every Twins reliever who has pitched at least 10 innings so far.
Before continuing, a couple of things need clarifying. PLV is Pitch Level Value. An explanation of it can be found on PitcherList’s website. In short, it is a stat that accounts for the stuff of a pitch, its location, and the batter’s handedness to grade how well a pitch was thrown. The correlation coefficient number below the chart represents the strength at which two variables are related. The closer to 1, the stronger.
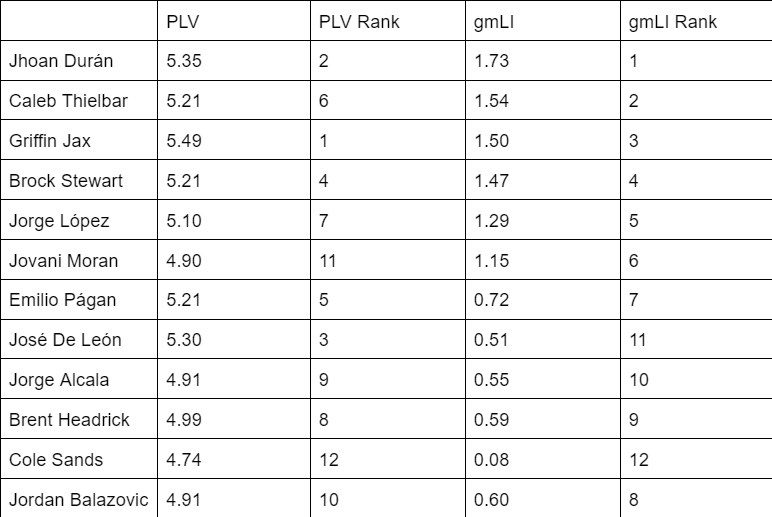
PLV-gmLI correlation: 0.5664
Considering that so many of these pitchers have relatively small workloads, it’s trickier than normal to make conclusions. As things stand right now, the Twins have mostly put the right pitchers in the right spots. A correlation coefficient of 0.4 is pretty typical, at least it was in 2022. I am unable to access the data to find an average number for 2023, but the major takeaway from this chart should be that Minnesota’s bullpen has been utilized mostly correctly.
We can even use this chart to see which pitchers may be primed for busier second halves. José De León has pitched exceptionally so far, though he has been used more like a mop-up duty reliever than what his skill-level warrants.
Hopefully, the ideas discussed in this article are thought-provoking. As John Foley asserts in his aforementioned article, the way in which relievers are deployed is almost guaranteed to be met with flak from fans. Looking at bullpen management in some of the ways considered here can be helpful in coming to conclusions.