The Minnesota Twins got off to a slow start offensively last season. Sitting 18th in runs per game halfway through June, the Twins rode a hot second half behind strong performances from rookies Royce Lewis, Matt Wallner, and Edouard Julien. Byron Buxton and Carlos Correa will return after injury-plagued seasons, and Minnesota added Manuel Margot and Carlos Santana, which likely rounded out their roster. Therefore, the opening-day lineup is set.
The Twins will be building their lineup with a diverse array of hitters. Some players excel at getting on base, like Julien. Others, like Wallner, have built their swing for power. And some, like Correa, balance hitting ability with low strikeout rates. There’s enough talent on the roster to build a decent lineup. But there’s a way for Minnesota to optimize runs scored.
Baseball researcher Tom Tango, co-author of The Book: Playing the Percentages of Baseball, devised a way to do so.
There are 24 base/out states in baseball. From the bases empty and no outs to the bases loaded with two outs, every game can comprise only the 24 states. A team in that first situation, with the bases empty and no outs, is expected to score a certain amount of runs until the end of the inning.
If the league average runs per Game is 5, as it was from 1999 to 2002, each team is expected to score 0.555 runs to start each inning. Suppose the leadoff hitter hits a home run. Then, the team is expected to score 1.555 runs before the end of the inning, generating 1 “Run Value.”
But a leadoff homer isn’t worth as much as a grand slam. Tango accounted for home runs in all 24 base/out states to assess the true Run Value of hitting a home run. He found that home runs had an average Run Value of 1.397. The value of a home run differs based on lineup spot, with some spots more likely to be in base/out states with runners on base.
By doing the same thing for every event (singles, walks, etc.), we can create a chart of Run Value of each event. Tango also accounts for the number of plate appearances each spot in the lineup sees, so the final product looks like this:
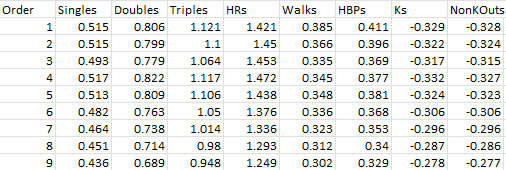
With this chart, I can multiply each Twins player’s event rate by these figures to determine their Run Value in each spot in the order. I’ll use Steamer’s projections via FanGraphs to do so.
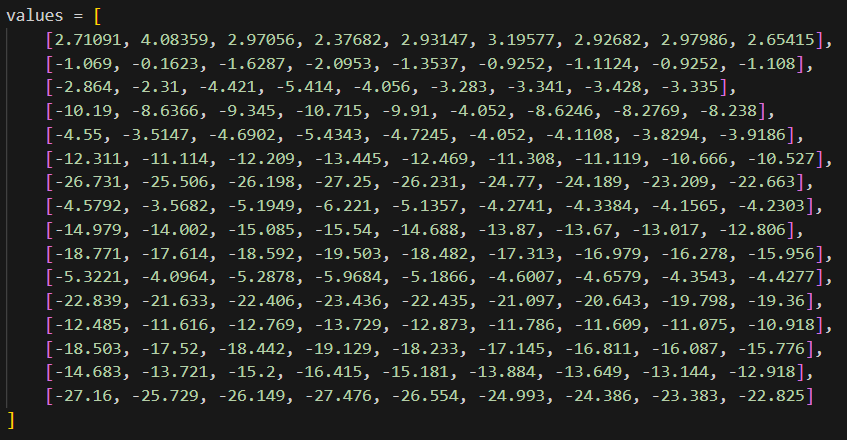
For example, Max Kepler is projected to hit a single on roughly 13.1% of his plate appearances in 2024. He’d hit 72.5 singles across 550 plate appearances, which is the number I’ve chosen to be standard for every hitter. Kepler’s singles would be worth just over 37 runs batting leadoff while being worth just under 32 runs in the 9th spot. This multiplication will be done for each event for each player, resulting in a table of values like this:
A computer programming tool called ortools will do the heavy lifting to figure out which lineup will be worth the most runs. It will use linear programming (LP), which runs through every possible lineup and selects the best one. Julien might be worth more runs batting second, but it might make more sense for him to leadoff if that produces the most runs based on who fills the rest of the lineup.
The resulting lineup might not be far off from expectations. The best hitters will be in the first five spots, with high OBP hitters, especially in the top three. Strikeouts are detrimental to cleanup hitters who need to make consistent contact, and hard contact at that, to drive in runs. Walks are naturally more important for leadoff hitters, although it doesn’t hurt to hit singles and especially doubles to make things easier for the 2-5 hitters. As long as Steamer’s projections are at least close to accurate, LP will assemble the best possible lineup.
Here’s what it put together for Minnesota:
- Edouard Julien, 2B
- Matt Wallner, LF
- Max Kepler, RF
- Royce Lewis, 3B
- Carlos Correa, SS
- Byron Buxton, CF
- Alex Kirilloff, 1B
- Ryan Jeffers, C
- Carlos Santana, DH
Unsurprisingly, the model says Julien should lead off, and Lewis should bat cleanup. Julien’s projected 14.5% walk rate and solid gap power make him an ideal table setter. Lewis is the best hitter on the team, with an ideal balance between strikeouts, power, and patience to get the most out of the cleanup spot.
The model projects Ryan Jeffers to build on his breakout last year in 2024. Christian Vázquez could carve out playing time, but Jeffers’ bat earns him the 8th spot in this optimized lineup.
The fifth spot is essentially a second cleanup spot, or at least Tango describes it as such in The Book. Correa may not have as much raw power as Buxton, but his ability to avoid strikeouts while piling up singles and doubles means he’ll take the fifth spot. Correa isn’t devoid of power, either, and he’s projected to hit plenty of home runs to further justify his placement. Last year’s exercise had him leading off, but with better OBP players now entrenched on the roster, he’d shine brightest racking up RBIs.
Kirilloff and Santana are the best hitters outside of 1-6. Santana projects to get on base plenty. While his walks are more valuable leading off, his overall hitting ability makes him more suitable to be a secondary leadoff man ahead of Julien, Wallner, and Kepler.
Wallner’s placement at second is noteworthy. He strikes out plenty (projected to be at 33%) and hits few singles. But his home run, walk, and even hit-by-pitch projections outweigh his flaws to some extent to make him the ideal second hitter for the Twins.
Kepler’s inclusion at third highlights some of Tango’s findings The Book. The second and fourth hitters are actually supposed to be the “best” hitters due to the base/out states they most often find themselves in and the Run Values certain events earn. Though his walks help, Kepler’s doubles and home runs push him into the third spot for the Twins.
Buxton represents an oddity. It’d make sense for him to bat second, fourth, or fifth, where his power can shine, but he gets out too often and plays for a team with five hitters who better fill the first five lineup spots. If anything, Buxton batting sixth displays Minnesota’s internal growth. There are sufficient OBP and lower strikeout power options to put ahead of him.
It must be noted that steals don’t factor into this exercise, so it may not fully appreciate players like Manuel Margot, Willi Castro, and even Buxton. However, there are reasons why the stolen base began to dwindle in popularity before last season. Modern baseball is still mostly centered around power, avoiding injuries, and letting hitters swing freely without the distractions associated with a baserunner gunning for second base.
Also of note is the complete disregard for platooning. Julien, Wallner, Kepler, and Kirilloff are all lefties. Some of them may be better suited in different spots depending on the opposing pitcher’s handedness. Steamer’s projections are full-season only, with no data available on their L/R splits.
Rocco Baldelli has plenty of lineups to experiment with, but this lineup is supposed to be the best, statistically. FanGraphs’ projected lineup against righties isn’t bad, scoring only about 5.5 fewer runs over an entire season (based on every player receiving 550 plate appearances), according to this model.