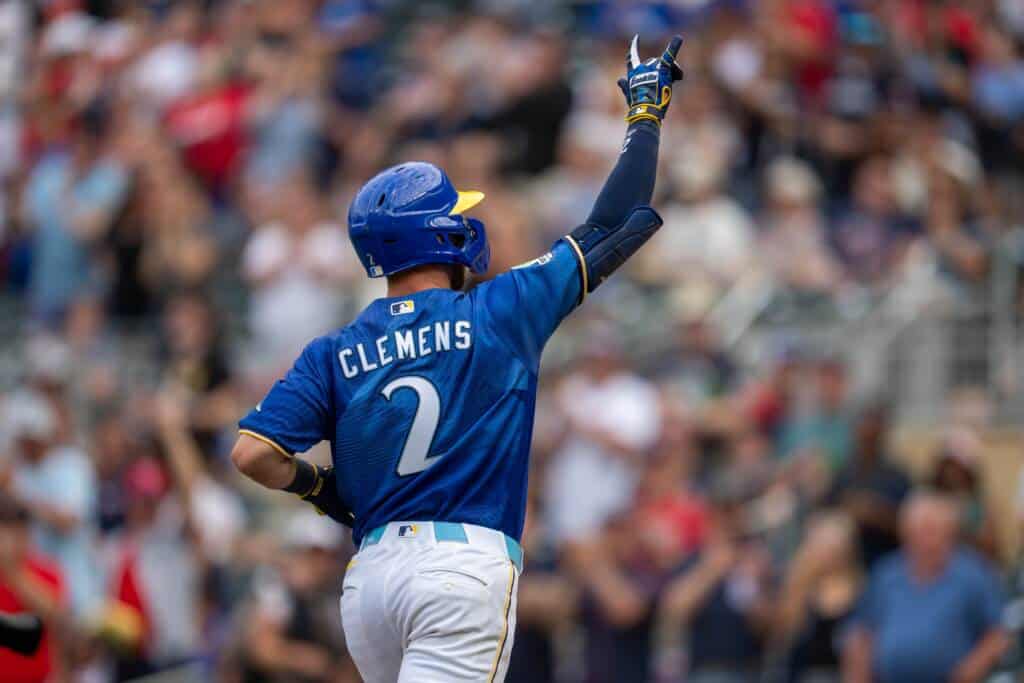
Every Minnesota Twins fan has witnessed paltry offense so far this season. Whether you’re at Target Field reminiscing while glancing over at the retired numbers or listening to Dick Bremer talk about Minnesota’s RISP woes, the Twins have struggled to score. They’re the 18th highest-scoring offense with 4.36 runs per game. If it wasn’t for otherworldly pitching allowing just 3.76 runs per game (third-best in the league), this team could be in trouble.
Minnesota’s lack of scoring could be an issue of roster construction or bad luck. But maybe it’s imprecisely built lineups. With a plethora of players who they can use to fill the nine spots, all of whom have greatly differing skill sets, I’m going to take a swing at optimizing the Twins lineup.
A lot of work has gone into trying to answer this question. Sabermetrician Tom Tango pioneered much of the process, giving baseball fans The Book to answer the game’s most difficult questions in addition to lineup optimization. If you’ve heard how the No. 2 hitter is actually supposed to be better than the guy in the three-hole, Tango is one of the people who determined that. Classic lineup construction looks something like this: a speedy leadoff man, a bat-control guru at second, the team’s best hitter third, power hitters at four and five, with six through nine decreasing in hitting ability. Optimal lineup construction challenges some of those points.
- A high OBP man leads off (speed does not matter as much here), with the best hitter batting second.
- The four-hole hitter could also be your best; what matters most is you have your best extra-bases guy at cleanup, which is what teams have typically done.
- Walks don’t do your cleanup man as much good as the hitter in the two-hole.
- The fourth-best hitter will bat third, with the fifth batting (naturally) fifth.
- All that really matters is having higher OBP at No. 1 and 2, with the players with higher slugging hitting No. 4 and 5.
Tango backs up his findings in his book, which I highly recommend checking out. I will summarize his points as best as I can. A game of baseball has 24 base/out states. A single with the bases empty and no outs is just as good as a walk in the same situation. The same is not true with two outs and a runner on second. A single in that situation can score runs, while a walk does not. Some players walk more than others, while some hit more singles. Putting them in their ideal situations as often as possible is Tango’s goal: to score more runs. It is thinking like this that is used in optimizing a lineup.
The number of runs the lineup scores can be maximized by putting specialized players in each lineup spot while factoring in:
- The number of plate appearances a batter at each lineup spot will get.
- The number of runners on they have during their plate appearances.
- And the base/out situations they are expected to see most.
Using OBP, SLG, and weighted on-base average (wOBA), I applied Tango’s findings to the Minnesota Twins. The numbers can be found below. Deciding on whether or not to incorporate Matt Wallner, Royce Lewis, and Edouard Julien was tricky. None of them have reached 100 MLB at-bats, making their statistics difficult to trust. In time, their true talent will reveal itself. For now, only Royce Lewis will be considered.

- Donovan Solano, 3B
Solano is the perfect table setter. His high OBP and wOBA make him one of Minnesota’s best hitters (are you surprised?). He can play third in this scenario. - Carlos Correa, SS
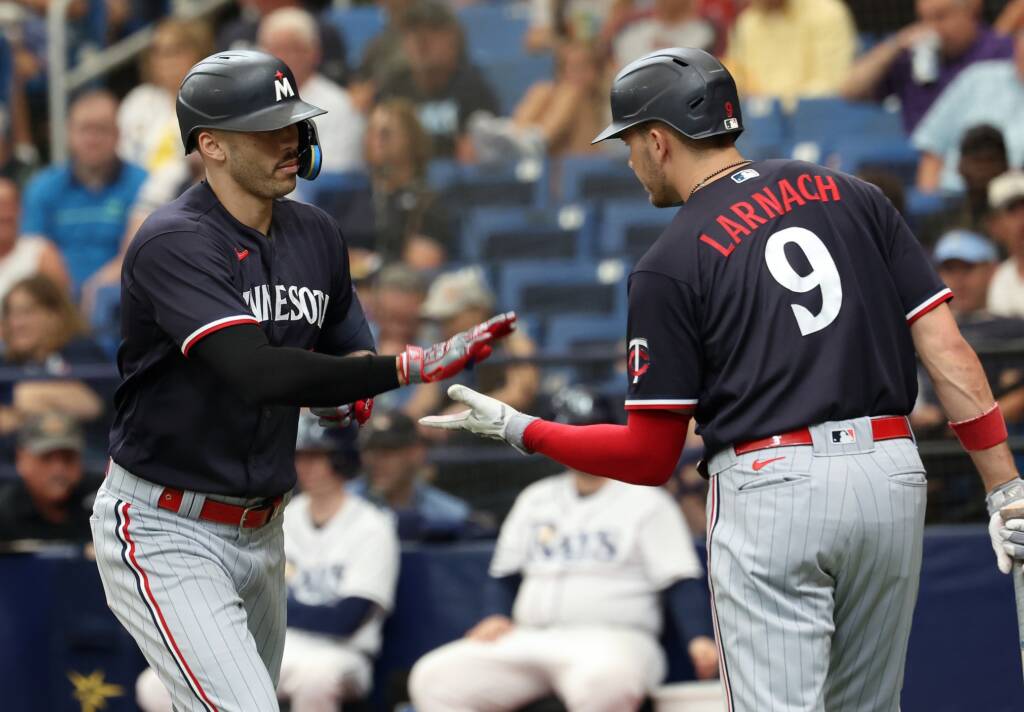
Hopefully the sluggish start has not soured one of the best shortstops in the game for you. - Jorge Polanco, 2B
Not quite the slugger like Buxton and Lewis, not quite the OBP machine like Solano and Correa. Perfect fit for one of the best hitters in this lineup. - Byron Buxton, DH
This was to be expected. Buxton has a SLG of 0.544. - Royce Lewis, CF
Despite the small sample size, this assumes Lewis is going to fulfill his destiny as a franchise player. - Alex Kirilloff, LF
Here begins the descent in wOBA. Kirilloff just doesn’t quite cut it in either OBP or SLG to put him in a premium position. He could become a candidate to leadoff iin the future. - Joey Gallo, RF
Gallo’s big bat almost convinced me to put him higher. Seventh is probably a good spot for him. - Jose Miranda, 1B
Miranda has a respectable 0.311 wOBA in his MLB career. He may need more seasoning in the minors, but he’s been good enough to warrant a spot in the lineup. - Ryan Jeffers, C
Every team needs a catcher. His elite power could be something to be excited about, but for now, Jeffers barely edges out Christian Vazquez here.
How many runs would this lineup score? Using the same stats as before, Seqnzr will answer that question. Seqnzr was created in Python, a commonly used programming language for data-related questions. Their tool will simulate this lineup in a variable amount of games, eventually spitting out the average number of runs the lineup scored. This lineup was predicted to score 4.93 runs per game.
Taking one step further, Seqnzr can also optimize the lineup. Because of inevitable human ineptitude, Seqnzr will make sure Tango’s process is applied correctly. I was personally unable to use this feature, as I quickly and unknowingly used up my seven free optimizations that their website allows. I discovered during my previous tinkering that Seqnzr only optimizes the nine players you input. Seeking a more complete answer will require more of The Book and some computer programming. Using a tool like Python or other programming languages will assure the best statistical lineup will be created.
A few things will be needed. The first is something to optimize by. This is provided by Tango. Using the entirety of the aforementioned data used during lineup construction (PA per position, base/out states, etc), he created a chart that gives what he calls run values. The numbers below represent the number of runs each event adds based on the batting order. The rows are as follows: spot in batting order (c1-c9), single, double, triple, home run, walk, HBP, strikeout, out.

These values can be multiplied by the rates at which each batter’s PA results in them. For example, Max Kepler hits a single on about 11% of his PAs. Those singles are worth the most at the fourth spot, with each being 0.517 runs added per single. To avoid multiplying fractions together, let’s convert 11% to singles per 1000 PAs, so 111. Multiplying 111 by 0.517 equates to roughly 57 runs per 1000 PAs. Putting Max Kepler fourth would result in 57 added runs from his singles. The same procedure would be used for each statistic.
The Twins’ numbers look like so:

Multiplying each player’s rates from the above chart by Tango’s run values results in yet another chart, which is below. Those numbers are the runs added from each player in 1000 PAs at each lineup spot. Once again, there’s no Wallner or Julien, but I included Lewis. To build suspense, the names associated with each row will not be divulged.

Assigning nine batters to a spot necessitates reinforcements. Mixed-integer programming will be used in this case. To maximize the value at each spot in the lineup, Python will run through each of these values until it finds the best solution. Because Python knows one batter can only fill one spot, it considers all solutions.

Here are the results. The batters’ names are included below this time:
- Carlos Correa
- Joey Gallo
- Byron Buxton
- Royce Lewis
- Jorge Polanco
- Donovan Solano
- Alex Kirilloff
- Kyle Farmer
- Jose Miranda
There is one small issue right off the bat; this lineup does not have a catcher. One of Ryan Jeffers or Christian Vazquez has to fit somewhere. The ninth spot would have the smallest effect on run production for both players, with Jeffers edging Vazquez out. The true optimal lineup looks like this:
- Carlos Correa, SS
- Joey Gallo, RF
- Byron Buxton, DH
- Royce Lewis, CF
- Jorge Polanco, 2B
- Donovan Solano, 1B
- Alex Kirilloff, LF
- Kyle Farmer, 3B
- Ryan Jeffers, C
Needless to say, this is different from even my own The Book lineup. My eyeball math made me put Solano first, but Correa has the superior OBP. Although he is valuable at nearly every spot, it was determined he’d make the most sense as the leadoff man. Buxton is actually the most valuable hitter there, but he was determined to be the three-hole man, not even cleanup like I had him. I believe this is because of Lewis’ poor OBP (Granted, it’s in around 75 PAs. Here’s the small sample size rearing its ugly head?). Lewis has an absurd 0.506 SLG so far in his career. Having Buxton in front of him means he’d have more chances to drive him in. Solano is the next-best hitter after the first five, with Kirilloff, Kyle Farmer, and Ryan Jeffers rounding it out.