Before, I’ve explained the concept of forecaster boards and evaluator boards when putting together the Consensus Big Board. The difference between the two kinds of public big boards allows us to better understand what various draft analysts are trying to do and what they accomplish.
There’s good evidence that big media boards are working off the same information. A less generous interpretation would be that they all copy each other, but the amount of information they retain and generate makes that unlikely.
What better fits is the fact that they all have unique access to scouts, coaches and front office personnel who themselves know their own intentions and information like injury concerns, potential red flags and unique access to All-22 game footage.
That lets them do a better job at predicting the NFL draft — every year, they rank in the top of the prediction awards released every year, and something we’ll go over once more as we cover the draft.
The forecaster board is better than any individual board in predicting the draft. In 2014 and 2015, it was the best board in predicting who would get selected in the top 100 and how close they would be to getting selected there. In 2016, it placed third behind Gil Brandt and an award winner to be named tomorrow.
The forecaster board is better than any individual board in predicting the draft.
The evaluator board differs from the forecaster board in some big ways every year, and sometimes that’s to its benefit. Instead of being taken in by information from teams who potentially have an agenda when it comes to leaks, most evaluators create their boards based off of the footage they see.
To the extent that there’s value in that “purity,” there’s at least a track record of success. While markedly worse than the forecaster board at predicting where players will get picked, it was just as good at predicting success despite working off of analysts with significantly less information.
That might mean when a player is forecasted to go lower than the evaluator board rates him, there’s a decent chance he could be a steal. On the other hand, it could mean there’s unknown medical or off-field information keeping that player down.
That does lead to some wild variability. Below are two charts: one that shows the variability in the top-50 players for the analysts contributing to the forecaster board and one showing the same for the evaluator board:


It’s not just that there’s more forecaster boards, there’s genuinely much more variability among those boards, even when looking at players in the the top 10. Players ranked in the consensus top nine are all inside the top fifteen of each individual board contributing the forecaster consensus.
On the other hand, some evaluators had No. 2 or No. 4 overall players place well outside No. 30 or No. 40 of their individual boards.
Let’s take a look at which players drew the largest disagreement between the two boards to see which players might surprise analysts with a fall and which players might be hidden values.
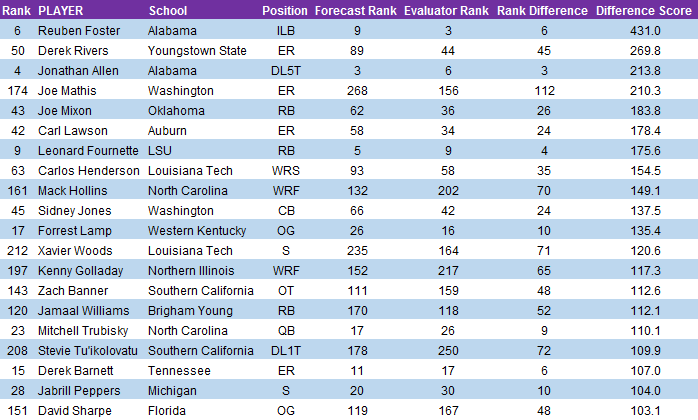
The past three years have indicated there’s a fairly clear pattern among players who end up representing the largest differences between two players. Typically, they are players who come from small schools, suffered an injury with an unknown time frame, have well-known character flags or are “tweeners” without a known true position.
That covers players like all of the players above except Carl Lawson, Leonard Fournette, Zach Banner, Mitchell Trubisky, Stevie Tu’ikolovatu, Derek Barnett and David Sharpe.
Fournette and Barnett have unique athletic profiles and players like Trubisky just draw different evaluations.
And the players that were the most well-agreed upon between the two boards are not all that surprising.

This is essentially a ranked order list of players one or zero ranks off from the other list. There’s typically nothing unique about the players other than the fact that they might be easy evaluations. Extremely good players like Myles Garrett or Solomon Thomas are easy for obvious reasons, while injury-ridden players like Jake Butt or small-school players like Taylor Moton are a bit more surprising.
Still, agreements happen, and they require a lot less explanation than disagreements.
Below are the top 50 players on the consensus board and their respective ranks in the forecaster board and evaluator boards. At our Google document of the ranked list of players, we’ve added tabs for the forecaster and evaluator boards.
| Rank | PLAYER | Position | Pos Rk | Forecast Rank | Evaluator Rank | Disagreement | Score |
| 1 | Myles Garrett | ER | 1 | 1 | 1 | 0 | -171.3 |
| 2 | Solomon Thomas | ER | 2 | 2 | 2 | 0 | -157.5 |
| 3 | Jamal Adams | S | 1 | 4 | 4 | 0 | -149.5 |
| 4 | Jonathan Allen | DL5T | 1 | 3 | 6 | 3 | 213.8 |
| 5 | Malik Hooker | S | 2 | 7 | 5 | 2 | 34.2 |
| 6 | Reuben Foster | ILB | 1 | 9 | 3 | 6 | 431.0 |
| 7 | Marshon Lattimore | CB | 1 | 6 | 7 | 1 | -53.1 |
| 8 | O.J. Howard | TE | 1 | 8 | 8 | 0 | -130.0 |
| 9 | Leonard Fournette | RB | 1 | 5 | 9 | 4 | 175.6 |
| 10 | Corey Davis | WRF | 1 | 14 | 10 | 4 | 48.0 |
| 11 | Mike Williams | WRF | 2 | 12 | 11 | 1 | -78.8 |
| 12 | Dalvin Cook | RB | 2 | 10 | 12 | 2 | -27.9 |
| 13 | Christian McCaffrey | RB | 3 | 13 | 13 | 0 | -120.4 |
| 14 | Haason Reddick | OLB | 1 | 16 | 14 | 2 | -50.0 |
| 15 | Derek Barnett | ER | 3 | 11 | 17 | 6 | 107.0 |
| 16 | David Njoku | TE | 2 | 19 | 18 | 1 | -88.4 |
| 17 | Forrest Lamp | OG | 1 | 26 | 16 | 10 | 135.4 |
| 18 | Gareon Conley | CB | 2 | 18 | 15 | 3 | -19.9 |
| 19 | John Ross | WRF | 3 | 15 | 19 | 4 | 9.1 |
| 20 | Ryan Ramczyk | OT | 1 | 22 | 20 | 2 | -62.7 |
| 21 | Marlon Humphrey | CB | 3 | 28 | 21 | 7 | 37.6 |
| 22 | Deshaun Watson | QB | 1 | 21 | 23 | 2 | -63.0 |
| 23 | Mitchell Trubisky | QB | 2 | 17 | 26 | 9 | 110.1 |
| 24 | Cam Robinson | OT | 2 | 25 | 24 | 1 | -87.1 |
| 25 | Malik McDowell | DL3T | 1 | 32 | 22 | 10 | 85.9 |
| 26 | Garett Bolles | OT | 3 | 23 | 25 | 2 | -63.6 |
| 27 | Takkarist McKinley | ER | 4 | 24 | 29 | 5 | -8.2 |
| 28 | Jabrill Peppers | S | 3 | 20 | 30 | 10 | 104.0 |
| 29 | Taco Charlton | ER | 5 | 30 | 28 | 2 | -68.9 |
| 30 | Budda Baker | S | 4 | 38 | 27 | 11 | 72.5 |
| 31 | Patrick Mahomes II | QB | 3 | 37 | 32 | 5 | -28.2 |
| 32 | Tre’Davious White | CB | 4 | 27 | 37 | 10 | 60.1 |
| 33 | Zach Cunningham | OLB | 2 | 33 | 35 | 2 | -71.5 |
| 34 | Obi Melifonwu | S | 5 | 46 | 31 | 15 | 102.3 |
| 35 | Charles Harris | ER | 6 | 29 | 38 | 9 | 38.7 |
| 36 | Evan Engram | TE | 3 | 35 | 41 | 6 | -18.5 |
| 37 | Jarrad Davis | ILB | 2 | 31 | 40 | 9 | 31.9 |
| 38 | DeShone Kizer | QB | 4 | 43 | 39 | 4 | -48.7 |
| 39 | Quincy Wilson | CB | 5 | 39 | 43 | 4 | -48.2 |
| 40 | T.J. Watt | ER | 7 | 41 | 33 | 8 | 13.9 |
| 41 | Kevin King | CB | 6 | 36 | 45 | 9 | 17.5 |
| 42 | Carl Lawson | ER | 8 | 58 | 34 | 24 | 178.4 |
| 43 | Joe Mixon | RB | 4 | 62 | 36 | 26 | 183.8 |
| 44 | Chidobe Awuzie | CB | 7 | 40 | 47 | 7 | -13.0 |
| 45 | Sidney Jones | CB | 8 | 66 | 42 | 24 | 137.5 |
| 46 | Adoree’ Jackson | CB | 9 | 34 | 48 | 14 | 82.6 |
| 47 | Tim Williams | ER | 9 | 44 | 50 | 6 | -28.9 |
| 48 | Dan Feeney | OG | 2 | 53 | 46 | 7 | -21.4 |
| 49 | Marcus Williams | S | 6 | 49 | 49 | 0 | -94.0 |
| 50 | Derek Rivers | ER | 10 | 89 | 44 | 45 | 269.8 |
RELATED: Who are the Top 300 Players in the Draft?