A big question people have when it comes to the consensus big board every year is, “which individual board have you gathered is the best?”
Unfortunately, there’s no easy answer and often that answer will change every year.
What does it mean to have the best board? Is it the board that most accurately predicts the draft picks and where they’ll be slotted? Is it the board that can serve as the most convenient go-to to determine the consensus? What about the board that best predicts performance? If a board gives you a different angle than every other board—giving you food for thought in the process—doesn’t that provide value?
“Best” is difficult to determine. Instead, I’ve decided to recognize boards for all of these qualities and have created awards every year for the contributor awards.
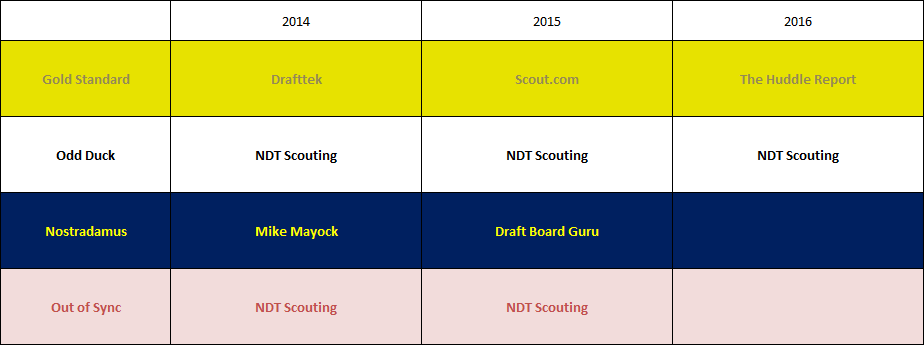
The Gold Standard award is for those boards that best reflect the consensus of the boards around them. If you only had one board to look at and didn’t have time to put together a consensus board, who would you look to?
Every year, the answer has been different. Drafttek in 2014 reflected the consensus of those around them, while Scout.com took home the trophy in 2015. This year, it’s the Huddle Report‘s value board, which is pretty distinct from their funky-looking “talent board” but much more useful.
The Odd Duck award is the opposite: this award rewards individuals for bucking trends and making bold decisions on player value and talent that stand starkly opposed to the consensus. For the third year in a row, NDT Scouting has produced the most unique board among NFL evaluators.
His prospectus is a fantastic read and he goes into exhaustive detail about his grades and his process, so it certainly is worth looking into.
We don’t have 2016 awards for “Nostradamus” or “Out of Sync” because these are about predicting the draft. Most mock draft contests take mock drafts (not boards) and give points for predicting the right pick spot, predicting the right team and bonuses for both. In this case, we’re only looking at how far away the value given by a board was from the value given by the NFL with their selection.
A first overall ranking for a player gives him 3000 points of value, per the Jimmy Johnson trade chart. A first overall selection for that same player means the NFL gave him 3000 points of value, meaning the difference between that board and the NFL is 0. If that player had been selected second overall, the difference would be 400 (the second overall pick is worth 2600 points of value). If selected third, the difference would be 800, and so on.
Take the sum of all the differences between value and pick, and we get the best “predictors” of the draft and those most likely to disagree with NFL valuation. The Nostradamus award goes to the best predictor and the Out of Sync award goes to those with the biggest disagreements.
Unsurprisingly, Mike Mayock dominated the first year of the competition, and as an insider who is a big part of our Forecaster board, his consistent predictive ability powers the most powerful overall board in predicting the draft. Check out his most recent rankings here.
DraftBoardGuru won in 2015 with their Top 100, and The Huddle Report’s scores place them second in their scoring system over the course of five years—behind the prophet himself, Bob McGinn.
Unsurprisingly, Crabbs’ boards with NDT Scouting did not predict the draft very well. He’s pretty OK with that and if in a couple of years, he does a better job predicting performance than the draft does, he’ll look pretty good.
Next year, we’ll look at how individual 2014 boards did at predicting player performance in 2016 and give out some meatier, perhaps more meaningful, awards.
If you’ve checked out the variance scores in the Consensus Big Board, you’ve already got a taste of this, but I figured it would be good to take a little bit of time and highlight the biggest differences across individual boards for specific players. Below are the most disagreed-upon players in the 2016 draft.
| Rank | Player | School | Position | Variance+ |
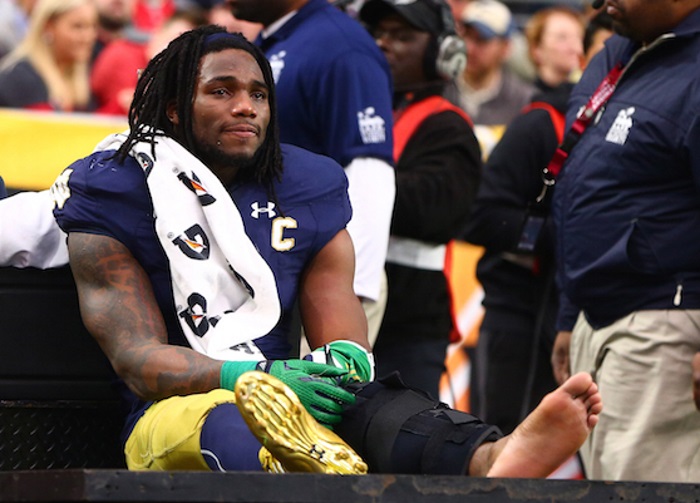
| 31 | Jaylon Smith | Notre Dame | OB | 165.8 |
| 286 | David Onyemata | Manitoba | ID | 155.6 |
| 15 | A’Shawn Robinson | Alabama | ID | 147.6 |
| 42 | Chris Jones | Mississippi State | ID | 137.9 |
| 255 | Tom Hackett | Utah | P | 131.7 |
| 102 | T.J. Green | Clemson | S | 130.6 |
| 206 | B.J. Goodson | Clemson | OB | 128.9 |
| 194 | Caleb Benenoch | UCLA | OT | 128.3 |
| 298 | Ka’imi Fairbairn | UCLA | K | 126.7 |
| 176 | Denver Kirkland | Arkansas | OG | 125.6 |
| 268 | Nick VanHoose | Northwestern | CB | 125.2 |
| 231 | Dominique Robertson | West Georgia | OT | 123.3 |
| 166 | Mike Thomas | Southern Mississippi | WR | 123.0 |
| 179 | Thomas Duarte | UCLA | TE | 122.8 |
| 32 | Jonathan Bullard | Florida | ED | 122.7 |
| 269 | Kalan Reed | Southern Mississippi | CB | 121.3 |
| 12 | Carson Wentz | North Dakota State | QB | 120.6 |
| 200 | Avery Young | Auburn | OT | 119.8 |
| 20 | Corey Coleman | Baylor | WR | 119.8 |
| 198 | Roger Lewis | Bowling Green | WR | 119.3 |
| 235 | Ryan Smith | North Carolina Central | CB | 118.8 |
| 229 | Darius Latham | Indiana | ID | 118.0 |
| 56 | Keanu Neal | Florida | S | 117.8 |
| 28 | Robert Nkemdiche | Ole Miss | ID | 117.1 |
| 116 | Isaac Seumalo | Oregon State | OG | 116.8 |
| 209 | Stephen Weatherly | Vanderbilt | OB | 116.7 |
Jaylon Smith’s variance comes from an obvious source—the uncertainty surrounding his injury—but the others are not necessarily so obvious.
For players like Robert Nkemdiche and Roger Lewis, off-field concerns likely speak to the issue for those players, while Thomas Duarte and Joanthan Bullard might face questions about which position is most ideal for them. Corey Coleman fits the mold of some gadget receivers who flamed out and players like T.J. Green and Chris Jones have been inconsistent from game to game.
Another common thread is school size. David Onyemata plays in Canada, while Mike Thomas plays for Southern Miss (as does Kalan Reed). Non-powerhouse schools like North Carolina Central, North Dakota State, West Georgia and to some extent Northwestern and Vanderbilt dominate the list because it can be difficult to find good film of those players.
I’m kind of surprised that there’s only one quarterback on the list. People seem to largely be in agreement about Jared Goff. You can also check out the players who drew the least variance:
| Rank | Player | School | Position | Variance+ |
| 51 | Tyler Boyd | Pittsburgh | WR | 78.4 |
| 187 | Brandon Shell | South Carolina | OT | 79.1 |
| 186 | Kevin Hogan | Stanford | QB | 79.2 |
| 55 | Shilique Calhoun | Michigan State | ED | 79.5 |
| 171 | Dadi Nicolas | Virginia Tech | ED | 80.1 |
| 180 | Travis Feeney | Washington | OB | 80.2 |
| 41 | Will Fuller | Notre Dame | WR | 80.8 |
| 193 | Nate Sudfeld | Indiana | QB | 80.9 |
| 59 | Kenneth Dixon | Louisiana Tech | RB | 81.0 |
| 290 | Tre Madden | Southern California | RB | 81.3 |
| 288 | Jordan Lomax | Iowa | S | 81.4 |
| 125 | Matt Ioannidis | Temple | ID | 81.4 |
| 168 | Daniel Lasco | California | RB | 81.5 |
| 77 | Pharoh Cooper | South Carolina | WR | 81.6 |
| 159 | Tajae Sharpe | Massachusetts | WR | 81.8 |
| 249 | D.J. Foster | Arizona State | WR | 81.8 |
| 37 | Cody Whitehair | Kansas State | OG | 82.0 |
| 74 | Austin Hooper | Stanford | TE | 82.0 |
| 155 | Kolby Listenbee | TCU | WR | 82.1 |
| 162 | Jason Fanaika | Utah | ED | 82.2 |
| 47 | Joshua Garnett | Stanford | OG | 82.3 |
| 263 | Taveze Calhoun | Mississippi State | CB | 82.3 |
| 133 | Joe Haeg | North Dakota State | OT | 82.3 |
| 185 | Daniel Braverman | Western Michigan | WR | 82.5 |
| 232 | Quinton Jefferson | Maryland | ID | 82.5 |
| 87 | Jordan Howard | Indiana | RB | 82.8 |
| 177 | Josh Ferguson | Illinois | RB | 82.8 |
I’m honestly surprised at many of these names. Will Fuller has created a lot of argument and players like Pharoh Cooper, Tyler Board and Tajae Sharpe exist at the divide between those who heavily weight data and measurements in those who don’t. Dadi Nicolas doesn’t seem to have a true position and Joe Haeg, Daniel Braverman and Sharpe all play at small schools.
In fairness, this measure tends to bias in favor of those who have low variance and are ranked lowly, so players like Jalen Ramsey and Laremy Tunsil—who have incredibly low variance—don’t show up at the top of these lists.